Around the 1950s, when the computational revolution was on the peak, scientists were bombarded with a rare problem that wreaked havoc in their minds. At that time, not many had anticipated such as Understanding Heatmaps problem. Thus, there was no specific solution for it.
To fix this issue, new methods and techniques were required. However, despite putting the best of efforts, the problem still lingered around. But what was the problem exactly? It was a lot of data. The upsurge of computers made it easier to collect data, leading to the accumulation of large-scale datasets that necessitated large-scale analyses.
One of the results from this unexpected need of advanced analytical methods was the introduction of heatmaps. They were originated to use with taxonomical datasets. However, the application of heatmaps in other areas was quick and effective.
What Are Heatmaps?
Heatmaps are considered as an advanced website tracking technique that shows colored reports developed depending on the user engagement and interaction with the website. With this feature, activities of website visitors are captured and assessed, based on the mouse movement, clicks, and scrolling movement.
The most engaged areas of the website are represented in bright colors, such as orange, yellow, and red. On the other hand, areas with low engagement are represented in green, purple, and other similar shades.
Why Are Heatmaps Important for Your Business?
There are several crucial advantages that online businesses can gain from heatmaps, such as:
- Heatmaps offer mouse click activity information of visitors that can be effective in enhancing CTA buttons placement, appearance, and content.
- They can help in improving visitor engagement.
- Heatmaps can be helpful in refining element usability, such as images, heading, CTA buttons, web forms, and much more.
- They can assist in customer acquisition and high conversion targeting.
- With heatmaps, you can improve website navigation, design, usability, conversion potential, and scroll ability.
Different Types of Heatmaps:
Although there is a wide range of heatmaps developed for varied purposes, below-mentioned are the three popular types-
- Click Heatmaps:
Mouse clicks are an important part of customer behaviour analysis and tracking. With this type of heatmap, you can get a clear understanding of the most and least clicked areas of your website. And with the data, you can easily enhance the less preferred areas and optimize the website accordingly.
- Scroll Heatmaps:
Just as the name suggests, this kind of heatmap provides adequate data that tells the scrolling behavior of your website visitors. It defines the scrolling depth and will help in using the real estate of the website effectively.
- Mouse Move Heatmaps:
This comprehensible type of heatmap lets you analyze and record mouse movements and clicks on the website. For an effective understanding of how visitors are behaving on your website and to which area they are scrolling the most, this type of heatmap will be a necessity.
How Do Heatmaps Work?
Heatmaps work by amassing data from a web page and showcasing the same data on the same web page. The entire procedure begins by taking a snapshot of a web page. And then, once the HTML loads, version of the loaded content are sent to the server via a short JavaScript section inserted into the code.
And then, a map of every page element is created. After that, the activity data is collected. Every time a visitor does something on that specific web page, the heatmap software records it. For instance: if a person visits the web page and clicks on an image, the software will record that click and add it into all the other information collected from that page.
Thus, while viewing that web page in the dashboard, you can see the aggregate data of every unique visitor. And hence, while looking into the heatmap, you get to see which area is getting attraction and which isn’t.
What Can You Gather from a Heatmap?
Data collected by heatmap will help you see:
- Headlines and images that attract visitors and get clicks
- Areas of core content that are hooking for visitors
- Whether or not visitors are paying attention to the area where you want them to
- Whether or not your navigation is working properly
- If people are finding it easy to locate search option
- How much of the content is read by visitors
How to Read Heatmap?
Reading heatmaps is intuitive and faster. However, they would still need to be decoded, which wouldn’t be a tough job for you. Here’s an example:
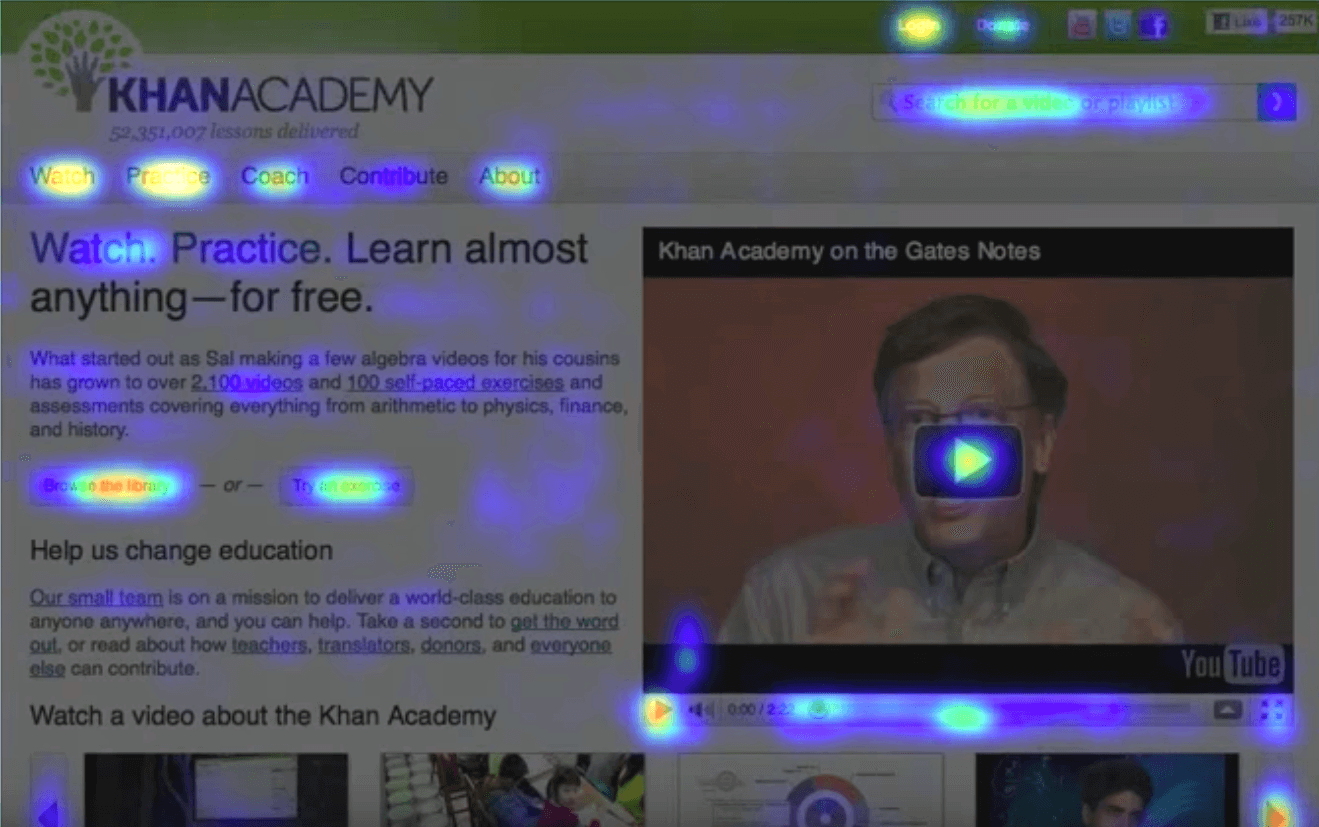
What does this picture show? In the top section, users are extensively clicking on:
- Watch
- Practice
- Coach
However, there seems to be not enough clicks on Contribute. And then, the Search button is getting a lot of attention. The video is even getting played a lot. Also, the social media links in the right-hand corner are not getting enough attention either.
In this way, by viewing where your visitors are clicking, you will get an idea for perfect optimization.
Here is another example for Scroll heatmap-
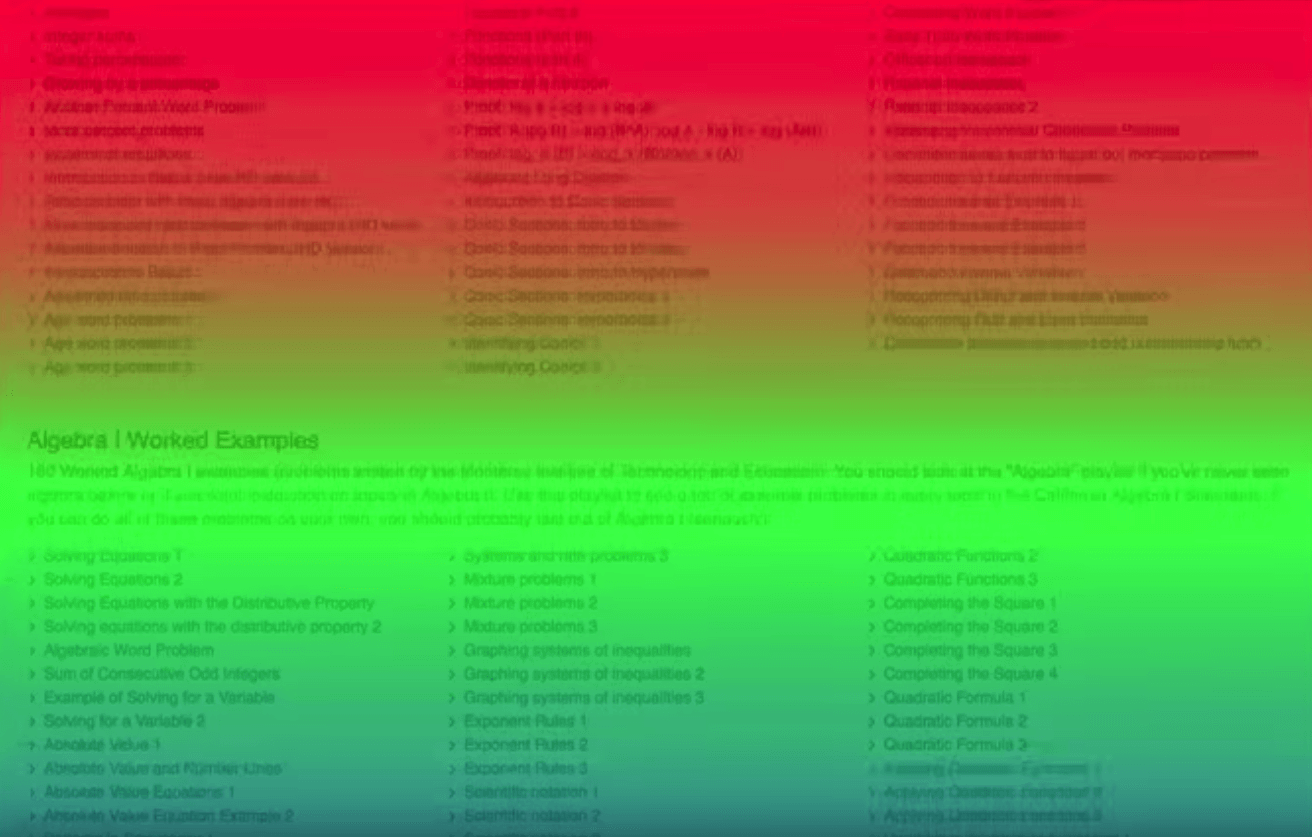
This image shows that users are not scrolling down enough to get more knowledge and information. The area colored in red is the scroll limit for users.
When Should You Use Heatmaps?
As dismissive as it may sound, heatmaps are useful and intuitive enough for you to use them almost all the time on a regular basis. Here are a few situations where using heatmap data can help you make better marketing decisions:
- Website Redesigning:
Redesigning a website can be a time-consuming and expensive task. And, the last thing that you would want is to redesign the site in such a way that it wouldn’t work at all. Thus, graphic designers can use heatmaps to understand user behavior and analyze it for such graphic elements that convert effectively, like contrast, color, placement and more.
- Content Marketing:
Regardless of how attractive and converting content, you are writing; you can never be so sure of whether your visitors are reading it or not. With scroll maps, you can easily figure out how long your visitors are scrolling. In this way, knowing if they are reading the content becomes easier.
And then, with click maps, you can even discover which CTAs are getting more click and which ones need rework.
- A/B Testing:
A/B Testing turns out to be crucial bumps in your conversion road that can help understand whether your business is obtaining an adequate response or not. In this situation, heatmaps can provide usable and instant insights into what different activities visitors take place into different versions of a single homepage, landing page, or a blog post.
When you are testing by changing the copy, moving the button, or editing images, you can see how conversion rates are working and can comprehend which page is converting better than the other option.
Conclusion:
With a heatmap, you can gain a precise and on-point indication of what exactly your visitors are doing on your website. This tool easily and quickly tells you whether users are clicking more on your images or CTA.
You can even look into the source of traffic along with several other analytical data. So, try using heatmaps on your website once and optimize it according to the needs of your visitors.